Compose to Cluster
Infrastructure · Docker Compose to Kubernetes · single-node homelab · Aug 2026
Prowlarr served a 2,822,144-byte SQLite database filled entirely with nulls for hours while Docker still reported the container healthy. Thirty Docker Compose services then became a Kubernetes cluster on one MacBook Pro. The Docker Compose to Kubernetes migration itself was routine. What it exposed was a decade of monitoring that reported healthy while being wrong.
TL;DR
Moving from Docker Compose to Kubernetes on a MacBook Pro solved repeated SQLite corruption by moving write-heavy databases off macOS virtiofs and onto local-path PVCs. The migration also exposed monitoring gaps where healthy processes hid corrupt data and missing metrics. OrbStack, Flux, VictoriaMetrics, and workload-specific probes now make those failures visible.
| Metric | Value | Detail |
|---|---|---|
| Compose services | 30 → 0 | docker-compose.yml deleted |
| Deployments | 40 | 27 apps · 7 monitoring · 6 flux |
| Volumes | 25 | local-path PVCs |
| Flux inventory | 124 | objects reconciled from git |
| Metric series | 76,524 | VictoriaMetrics |
| Log lines / 24h | 176,961 | VictoriaLogs, 30d retention |
Contents
- Why move at all
- Picking the substrate
- The storage bug that forced it
- Two networking asymmetries
- The migration pattern
- Caddy, and one flag
- Replacing the dashboards
- Flux, SOPS, pruning
- The pattern in the failures
- Where it stands
01. Why move at all
The stack ran thirty services under a single docker-compose.yml on a MacBook Pro: the arr media pipeline, Jellyfin, Immich, Home Assistant, Vaultwarden, Karakeep, a Minecraft server, and Caddy in front of all of it with a Cloudflare DNS-01 wildcard. It worked. Compose is a good tool and nothing about it was failing to schedule containers.
What was failing was state. Over four months, five SQLite databases were destroyed in place: Prowlarr three times, Home Assistant's recorder, Jellyfin, Beszel. Each time the pattern was identical: a database file zero-filled to its original byte length, the container reporting healthy, and every query silently failing behind it. Prowlarr once served 2,822,144 bytes of nulls for hours while the health check stayed green.
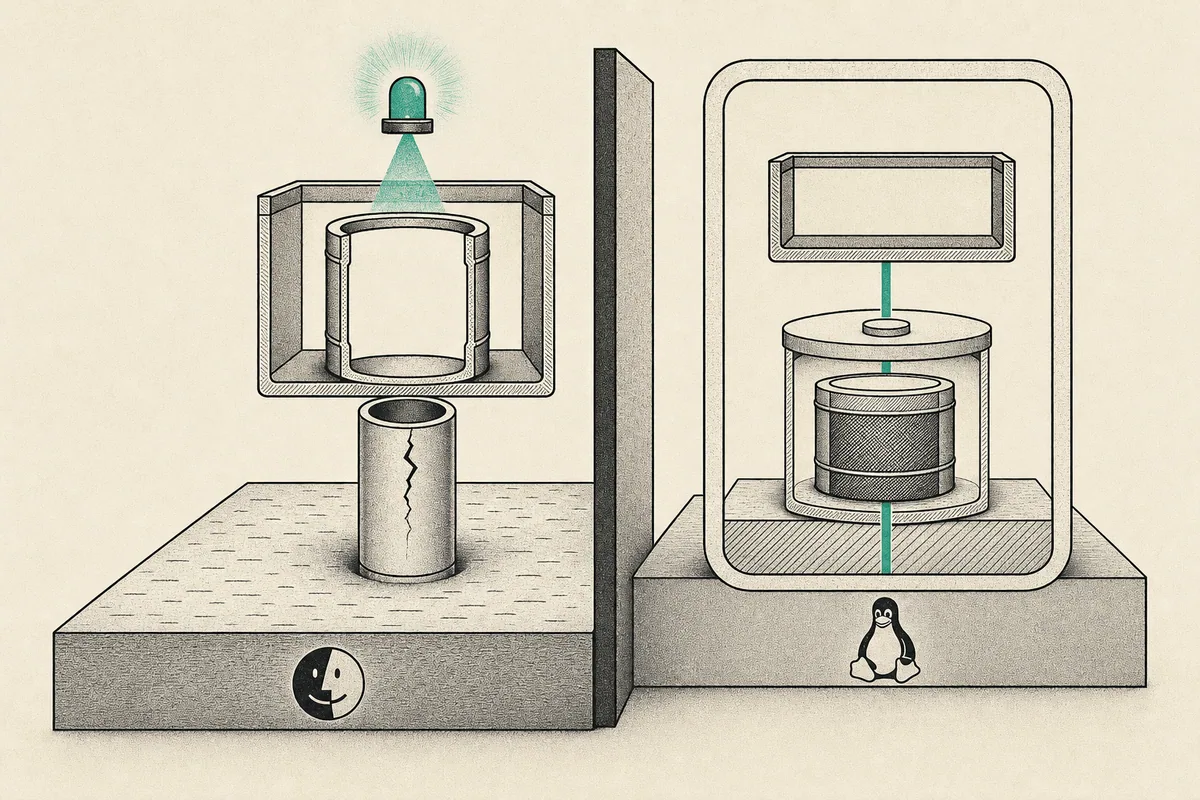
The common factor was the bind mount. Compose mounted host directories straight into containers, and on macOS that path runs through virtiofs. In this setup, repeated high-write SQLite corruption was confined to those virtiofs bind mounts. That is the actual reason for the migration: not orchestration, but a storage abstraction that could put the write-heavy files somewhere the host filesystem wasn't.
02. Picking the substrate
Four candidates were considered and three rejected. Dokploy and Coolify are Compose wrappers: they would have kept the bind mounts, which was the entire problem. k3d runs k3s in Docker, adding a layer of nesting on a machine that already virtualises everything once.
The choice was OrbStack's built-in Kubernetes, enabled with one setting:
orb config set k8s.enable true
$ kubectl version -o json | jq -r .serverVersion.gitVersion
v1.34.8+orb1

$ kubectl get node orbstack -o jsonpath='{.status.nodeInfo.containerRuntimeVersion}'
docker://29.4.0

$ kubectl get sc
NAME                   PROVISIONER             RECLAIMPOLICY
local-path (default)   rancher.io/local-path   Delete
One node, Flannel CNI, local-path storage. The PV paths later revealed themselves as /var/lib/rancher/k3s/storage/…: OrbStack's Kubernetes is k3s underneath, which the docs don't advertise.
The decisive property is that local-path PVCs live inside the Linux VM's own ext4 filesystem, not on the macOS host through virtiofs. Moving a database from a bind mount to a PVC moves it off the filesystem that was eating it. That single fact is what made Kubernetes the answer rather than a fashion.
03. The storage bug that forced it
Worth being precise, because it shaped every subsequent decision. The evidence here is correlation, not a filesystem-level reproducer: every failure involved a write-heavy SQLite database on a virtiofs bind mount, and the failures stopped after moving those files to ext4 PVCs. SQLite documents how unreliable filesystem sync or locking can cause corruption, which fits the observed signature without proving the exact failing syscall.
| What Docker reported | What was true |
|---|---|
prowlarr: Up 6 days (healthy). HTTP 200 on /ping. Container logs clean. | prowlarr.db: 2,822,144 bytes, every one of them 0x00. No valid SQLite header. Every indexer search failing silently. |
The health check was answering from a process that hadn't yet touched the corrupt pages. This is why the eventual monitoring design checks the file, not the process: a 15-byte header comparison that costs nothing and targets the zero-fill failure actually observed here:
scripts/container-watchdog.sh: the probe that survived the migration
# A healthy container is not the same as a healthy database. A valid SQLite
# file begins with this 15-byte magic string; a mismatch catches the missing
# or zero-filled header failure observed here.
header=$(kubectl -n "$NS" exec "deploy/$probe_container" -- \
         head -c 15 "$probe_db" 2>/dev/null | tr -d '\0')
[ "$header" = "SQLite format 3" ] || corrupt="$probe_container"
Deliberately a header check rather than PRAGMA integrity_check: it needs no sqlite binary in the image, costs one syscall, and catches the failure mode actually observed here.
04. Two networking asymmetries
Running Compose and Kubernetes side by side during a staged migration surfaced two asymmetries that dictated the migration order.
DNS resolves one way only
A Compose container can resolve <svc>.selfhost.svc.cluster.local: OrbStack wires the VM's resolver into both. A pod cannot resolve a Compose container name. A migrated service still depending on an unmigrated one had to address it as host.docker.internal:<published-port>, and only where that service published a port at all.
The consequence is an ordering constraint: move a service after the things it depends on, not before, so the temporary host.docker.internal wiring is short-lived. Six Caddy routes still use it today, pointing at Go daemons that run under launchd on the Mac and serve iOS Shortcuts on loopback. Those work from inside pods, which was worth verifying rather than assuming: Go's default 404 body is exactly 19 bytes, so a 19-byte response proved the backend was being reached.
LoadBalancer and published ports bind differently
This one nearly ended the migration one service short.
lsof -nP -iTCP -sTCP:LISTEN: before the fix
OrbStack  127.0.0.1:8989   # kubernetes LoadBalancer (sonarr)
OrbStack  *:443            # compose published port (caddy)
A LoadBalancer Service answered on loopback only; a Compose published port bound every interface. For any service reached through Caddy this is invisible. For Caddy itself: reached directly from phones over Tailscale: it means every route goes dark from anywhere but the Mac.
The conclusion at the time was that Caddy was the one service the cluster could not host, and Compose would be kept alive for it alone. That conclusion was wrong, and section 06 is why.
05. The Docker Compose to Kubernetes migration pattern
Twenty-nine services moved using the same six steps. Codifying it mattered more than any individual manifest, because the per-service work then reduced to spotting the exception.
Every manifest follows the same conventions: images pinned by digest, resource requests and limits on every container, startupProbe carrying slow boots so livenessProbe can't restart mid-start, and strategy: Recreate for anything on a ReadWriteOnce volume. Data seeding used a throwaway alpine pod mounting the target PVC, with tar streamed into it.
The exceptions were where the work was
Per-service traps, and what each one taught
| Service | Symptom | Cause |
|---|---|---|
fava | crash-loop on boot | Kubernetes injects <NAME>_PORT=tcp://ip:port for every Service. Fava's CLI reads FAVA_PORT as --port. Fixed with enableServiceLinks: false. |
seerr | EACCES mkdir /app/config/logs | Image runs as node:node (1000). Needed fsGroup: 1000 plus a chown of the seeded PVC. |
homeassistant | HTTP 400 on every proxied request | See below: the most instructive failure of the migration. |
pinchflat | OOMKilled ×4 | The BEAM holds a whole media batch while it works; 1 GiB was under peak. Raised to 2 GiB. |
prowlarr | arr indexers 401 | Stale API key persisted in each arr's IndexerStatus rows; needed ?forceSave=true and a backoff-state clear. |
Home Assistant: the config file that stopped being read
After moving, every request through Caddy returned 400 with Received X-Forwarded-For header from an untrusted proxy 192.168.194.1. Compose-to-cluster traffic is source-NAT'd to the node gateway, so adding 192.168.194.0/24 to trusted_proxies in configuration.yaml should have fixed it. It didn't: through several restarts, with the value verified present inside the pod.
/config/.storage/http: the file that actually governs
{
  "data": {
    "stable": {
      "use_x_forwarded_for": true,
      "trusted_proxies": ["192.168.97.0/24", "172.16.0.0/12", "127.0.0.1/32"],
      "created_at": "2026-08-06T05:55:42Z"
    },
    "yaml_migration_done": true
  }
}
Home Assistant 2026.8 imports the http: block into .storage/http once, then sets yaml_migration_done. After that the YAML is read and discarded with no warning in the log. Patching the stored copy with the pod stopped took the proxied request from 400 to 200 immediately.
The lesson generalises past Home Assistant: when a config change provably has no effect, stop re-applying it and go find what is actually being read.
06. Caddy, and one flag
Caddy was written off as unmovable on the evidence in section 04. Twenty-nine services ran in Kubernetes; Compose survived for one. Re-examining OrbStack's own configuration rather than the symptom:
orb config show
docker.expose_ports_to_lan: true
k8s.expose_services:       false   ← the entire asymmetry
The difference between loopback-only and all-interfaces was a setting, not a property of Kubernetes Services.
Flipping it and restarting took sonarr's LoadBalancer from unreachable to 302 from another machine. Caddy then migrated like anything else, and nothing else about it was hard: the locally-built caddy-cloudflare:local image was already visible to the cluster (OrbStack shares its image store, so imagePullPolicy: Never finds it), TLS is a DNS-01 wildcard so there is no inbound challenge to route, and seeding /data from the old bind mount carried the existing certificate over rather than re-issuing: verified by its unchanged July validity dates. All 31 hostnames answered. docker-compose.yml was deleted.
A constraint that looks architectural is worth re-testing once. This one cost a week of believing Compose was permanent.
07. Replacing the dashboards
The pre-migration monitoring was Beszel for host and container stats, Glance for a homepage, and Gatus for uptime checks. None of it could answer "why did this get slow at 03:00" because none of it retained anything.
The replacement is VictoriaMetrics and VictoriaLogs rather than Prometheus and Loki, for one reason: this is a laptop-class machine. The whole stack requests about 1.4 GiB. Prometheus alone would want more for the same targets.
The stack, and what each piece replaced
| Component | Role | Replaced |
|---|---|---|
victoria-metrics | TSDB, 6-month retention | Beszel's history (there wasn't any) |
vmagent | Scrapes 7 targets | : |
victoria-logs | Logs, -retentionPeriod=30d | nothing: logs were unretained |
vector | DaemonSet tailing all pod logs | : |
grafana | 4 dashboards over both sources | Beszel UI |
vmalert + alertmanager | 22 rules → Telegram | ad-hoc notify.sh calls |
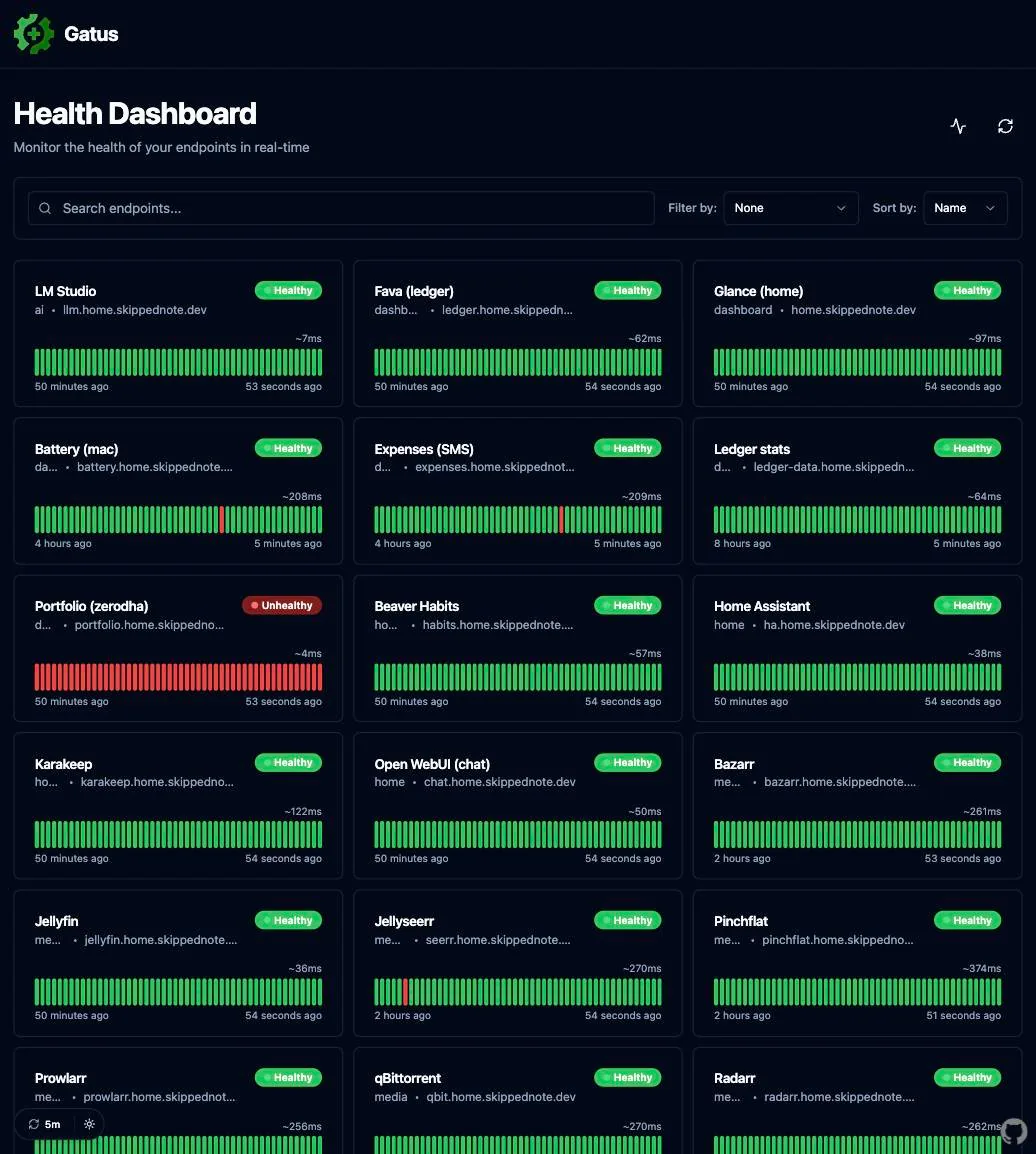
gatus.home.skippednote.dev
Synthetic uptime checks, kept rather than replaced: blackbox probing is a different job from metrics. The one red card is real, and instructive: the endpoint returned 200 in 144 ms, but the check asserts [BODY].status == ok and the JSON said token_expired. A connectivity probe would have called that healthy.
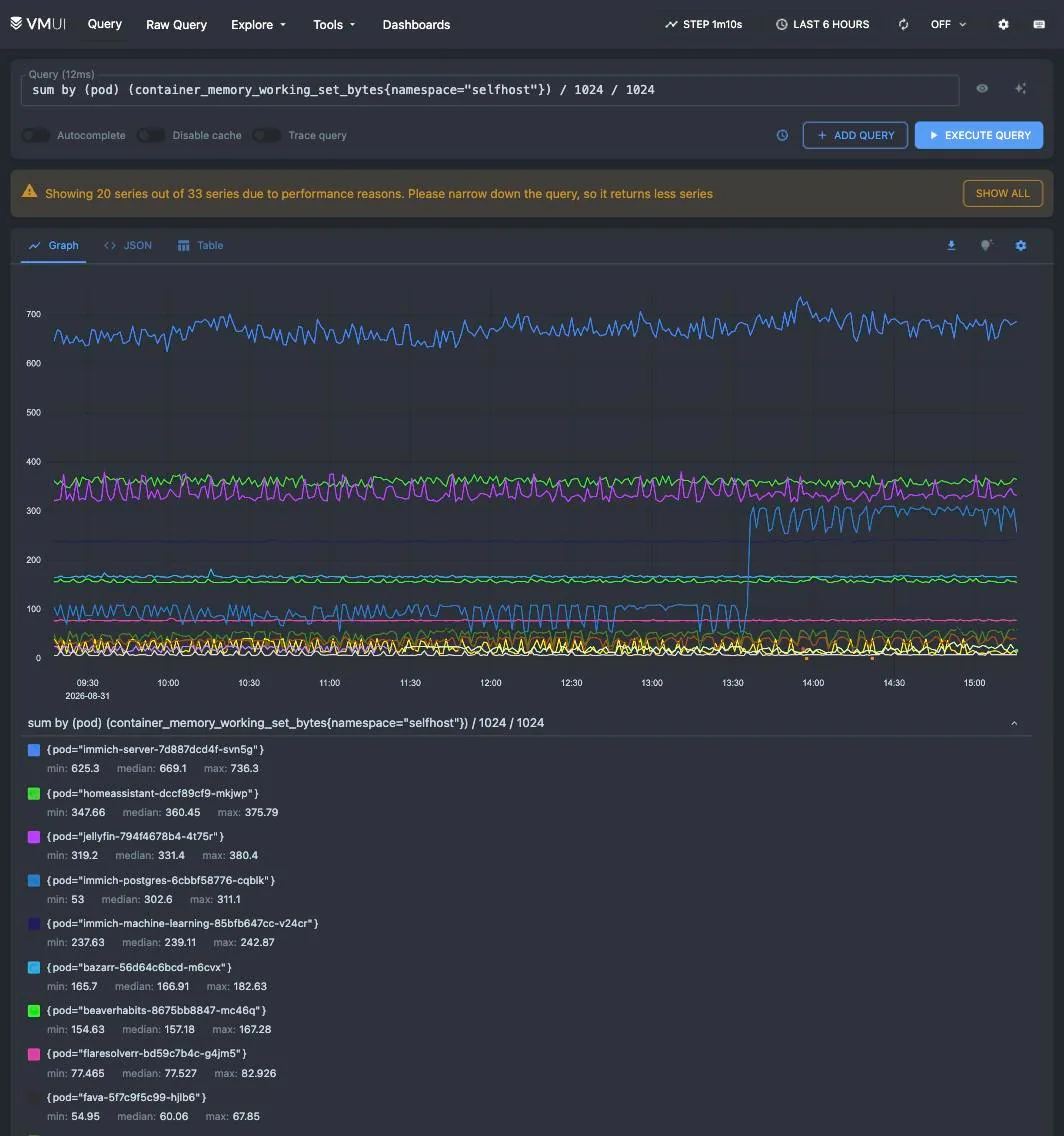
metrics.home.skippednote.dev/vmui
Per-pod working set across six hours, 33 series, answered in 12 ms: the series that had to come from /metrics/resource after cAdvisor produced none. The step in immich-postgres at 13:30, from 53 MB to just over 300, is the kind of change that was simply invisible before any of this existed: Beszel kept no history to compare against.
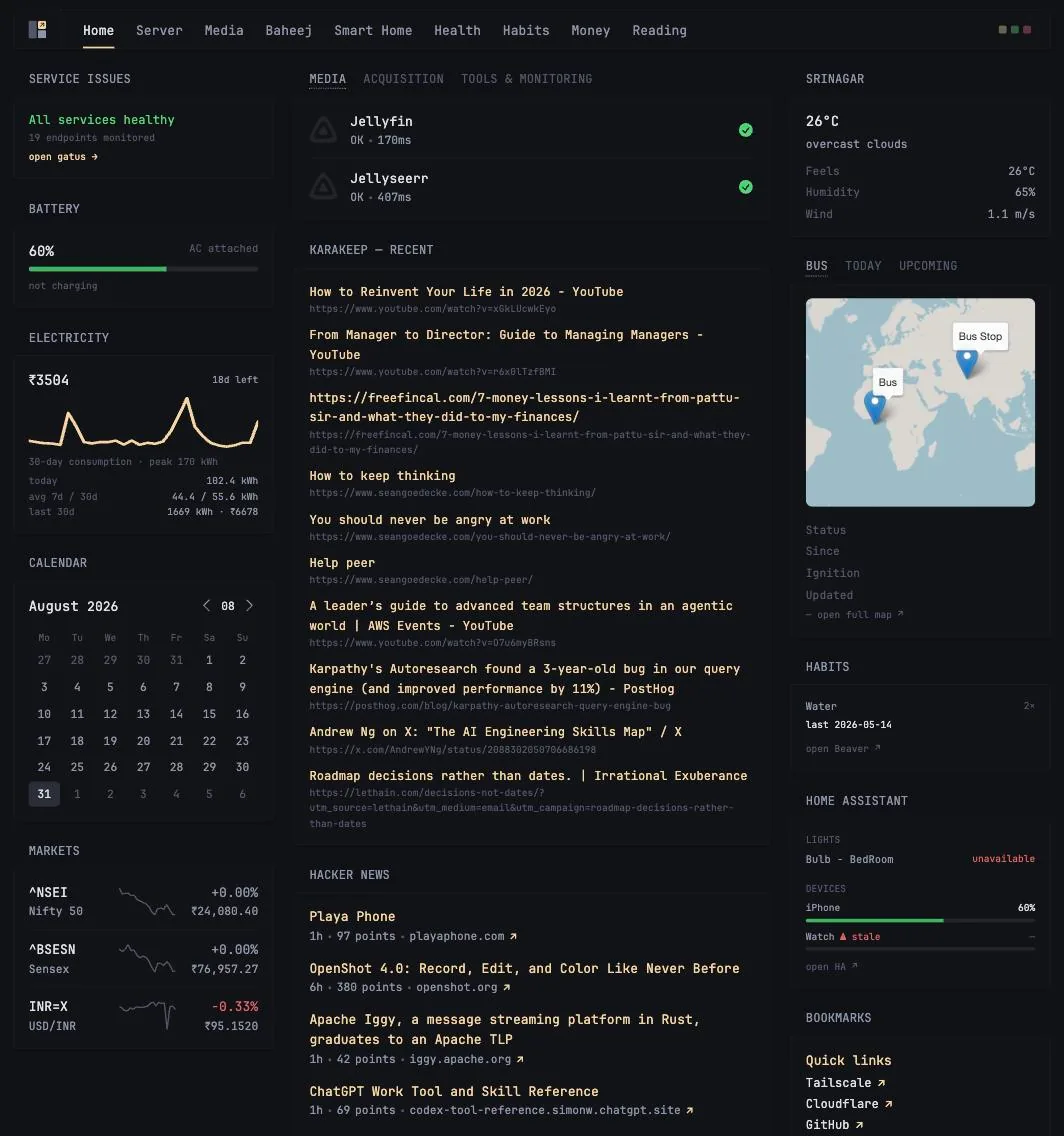
home.skippednote.dev
Glance was kept, not retired. Its 50 custom-api widgets, feeds and markets are a homepage, and Grafana does not replace that: only its four host-stats and container widgets were removed as genuine duplicates. Captured after two fixes: the panel top-left reads All services healthy now that the broker token above has been renewed, and the Bus widget draws its map again. CartoDB moved their free raster basemaps behind an API key, so every tile had been returning a placeholder until the layer was repointed at OpenStreetMap.
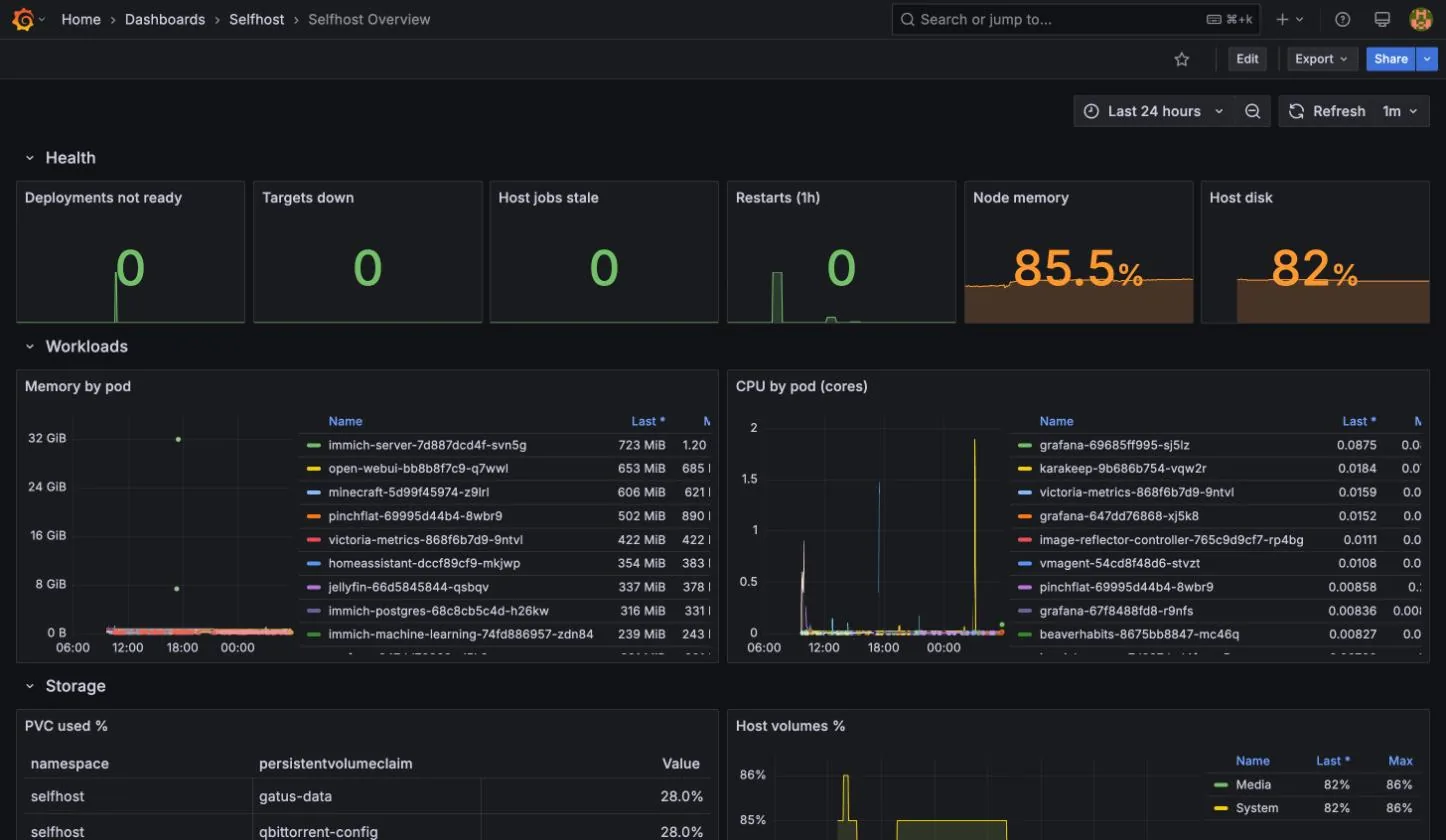
grafana: Selfhost Overview
Built against metrics that exist on this substrate rather than the ones a generic dashboard assumes: deployments not ready, scrape targets down, stale host jobs, restarts in the last hour, then memory and CPU per pod, PVC usage, and the launchd jobs' output age. Node memory at 85.5% is the honest number: this is a 16 GB Mac running 42 deployments.
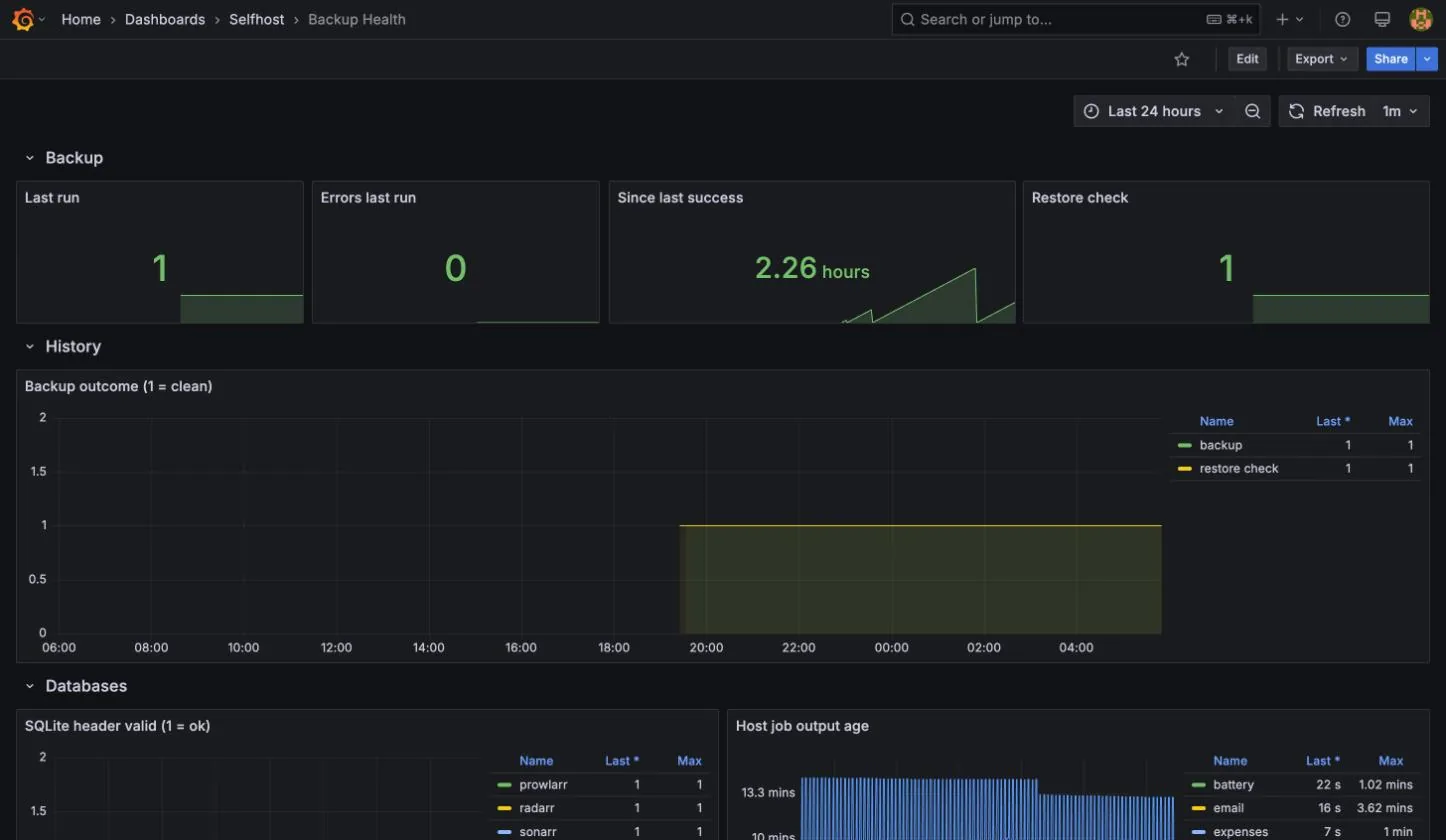
grafana: Backup Health
The dashboard worth having. selfhost_backup_success, selfhost_restore_check_success and selfhost_database_ok are published by host scripts through node-exporter's textfile collector, so a 03:30 failure becomes a graph and an alert rather than a line in a log nobody reads. SQLite header valid is the probe that caught prowlarr serving a zero-filled database while reporting healthy.
Two collection problems were specific to this substrate and worth recording, because both produced silently empty dashboards rather than errors.
cAdvisor gives nothing. OrbStack's kubelet answers /metrics/cadvisor with 25 lines of machine_* and not one container_* series. Deploying standalone cAdvisor produced 15,041 lines across 66 metric families: every one labelled by raw cgroup path (id="/kubepods/burstable") with no pod attribution, because it resolves names by asking the container runtime and never managed to here. Giving it the host cgroup tree, hostPID, and a writable Docker socket changed nothing. It was removed. The same kubelet serves 436 usable lines on /metrics/resource, which is what the cluster scrapes now: CPU and memory per container, no network or filesystem.
Disk metrics were worse than absent. node-exporter sees the host through virtiofs, which reports an identical fake 126 TB for every mount and no / at all:
Bogus node_filesystem_size_bytes values reported through virtiofs
/Applications   126562.5 GB   fstype=virtiofs
/Library        126562.5 GB   fstype=virtiofs
/Users          126562.5 GB   fstype=virtiofs
/mnt/mac        126562.5 GB   fstype=virtiofs
(no "/" mountpoint at all)
The DiskFillingUp rule queried node_filesystem_avail_bytes{mountpoint="/"}: a series that does not exist. It would have stayed silent through a full disk. The real figures come from a launchd script that already computed them for its own notifications; it now writes them to node-exporter's textfile collector instead.
08. Flux, SOPS, pruning
Manifests in git that are applied by hand are documentation, not a source of truth. Flux closes that gap: it reconciles ./k8s and ./k8s/monitoring every ten minutes over a read-only deploy key.
flux get all
NAME                              REVISION            SUSPENDED  READY  MESSAGE
gitrepository/selfhost            main@sha1:106d8698  False      True   stored artifact
kustomization/selfhost-apps       main@sha1:106d8698  False      True   Applied revision
kustomization/selfhost-monitoring main@sha1:106d8698  False      True   Applied revision
Pruning: Flux deleting objects that leave git: had to stay off initially, because ten Secrets existed only in the cluster, built by a bootstrap script from .env. With pruning on, Flux would have seen orphans and deleted alerting, Grafana's login, and Glance's API keys.
SOPS resolved that. An age keypair encrypts the secrets into git with only the values as ciphertext; names, namespaces and types stay readable, so kustomize still builds and a diff still shows which secret changed:
k8s/secrets/selfhost-caddy.sops.yaml
apiVersion: v1
kind: Secret
metadata:
    name: caddy
    namespace: selfhost
type: Opaque
data:
    cloudflare-api-token: SOPS_ENCRYPTED_VALUE
The private key lives in a password manager; the cluster holds a copy as flux-system/sops-age for the kustomize-controller. The public key is committed in .sops.yaml and isn't sensitive.
Before enabling pruning, decryption was proved non-destructive: secret values were byte-identical (same SHA-256) after Flux applied them. Then pruning went on, and nothing was deleted: Flux prunes only its own inventory of 124 objects, so the bootstrap-created ConfigMaps were never candidates.
One bootstrapping problem is worth noting: the decryption config lives in the path Flux reconciles, and Flux couldn't reconcile that path until it could decrypt. One manual kubectl apply broke the loop. Pruning's first real demonstration came a day later, when a removed cAdvisor DaemonSet deleted itself on the next reconcile.
09. The pattern in the failures
Every significant problem in this migration shared one shape: a component reported success while doing nothing. Collected, because the list is more useful than any single fix.
| Reported | Actual |
|---|---|
vmalert: running, 0 errors, config file on disk containing 22 rules. | Evaluating 10. -configCheckInterval does not reload rules; only a manual POST /-/reload picked them up. |
| Reported | Actual |
|---|---|
vmagent: target list healthy, all scrapes up, new job committed and applied by Flux. | Serving the config it booted with. A ConfigMap rewrite doesn't change the pod spec, so nothing restarted. |
| Reported | Actual |
|---|---|
job-health: exit 0. No alert since 3 August. | State file read bad for 27 days. It alerts only on state change, so a permanently broken feed looked identical to a healthy one. |
| Reported | Actual |
|---|---|
restic: retention policy applied every run, logs clean. | 56 snapshots, nothing ever pruned. Each run backs up a new dated directory, so default grouping by host+paths gave every snapshot its own group, and every group trivially satisfied "keep 7 daily". |
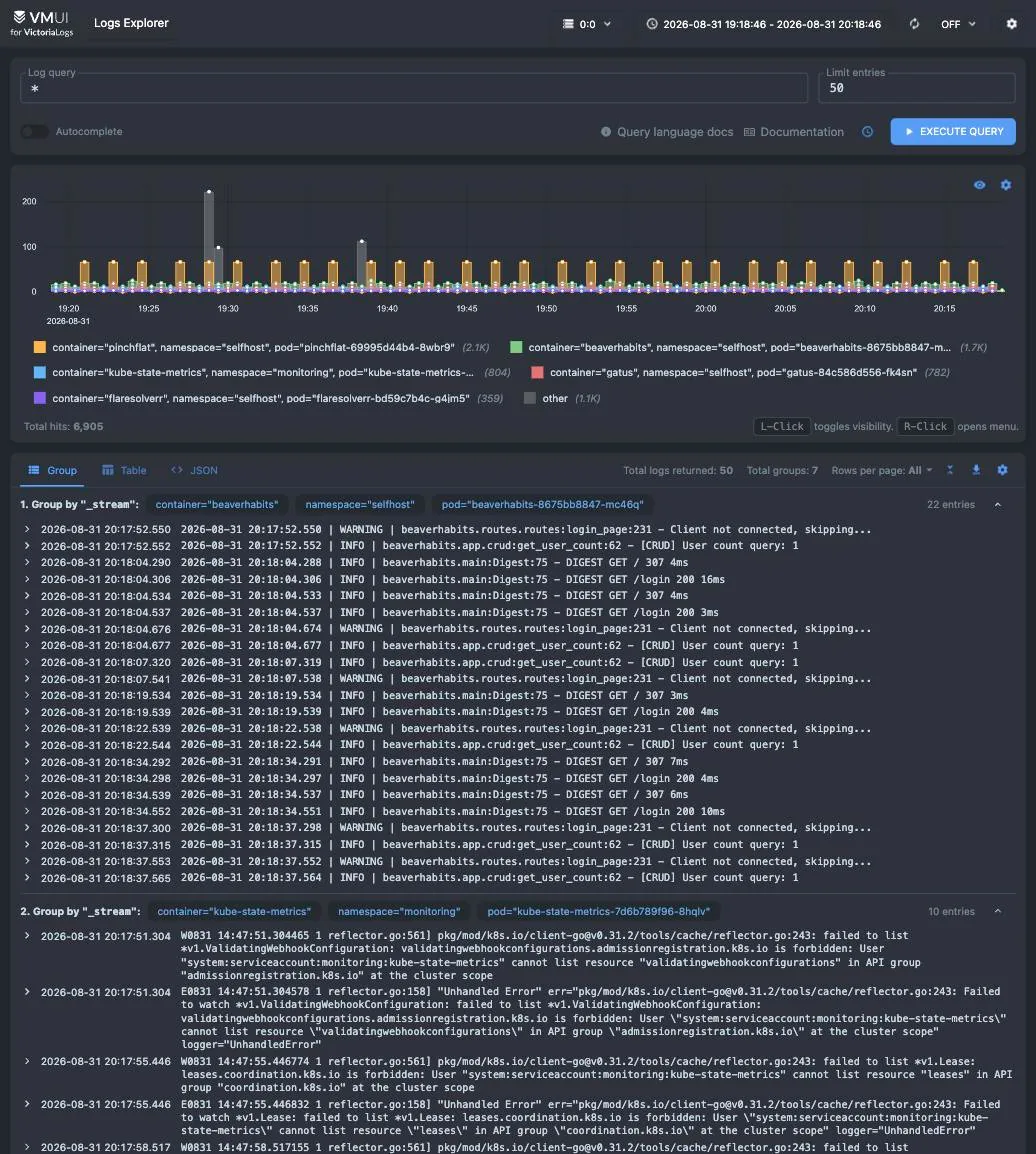
logs.home.skippednote.dev: VictoriaLogs
6,905 lines in an hour, grouped by stream. This view was opened to illustrate the article and immediately surfaced an unrelated bug: kube-state-metrics logging roughly a hundred forbidden errors an hour against leases, poddisruptionbudgets and both webhook-configuration resources. Its ClusterRole had been written from the resources this cluster needed rather than the ones it collects by default. Scrapes still succeeded; those collectors just returned nothing.
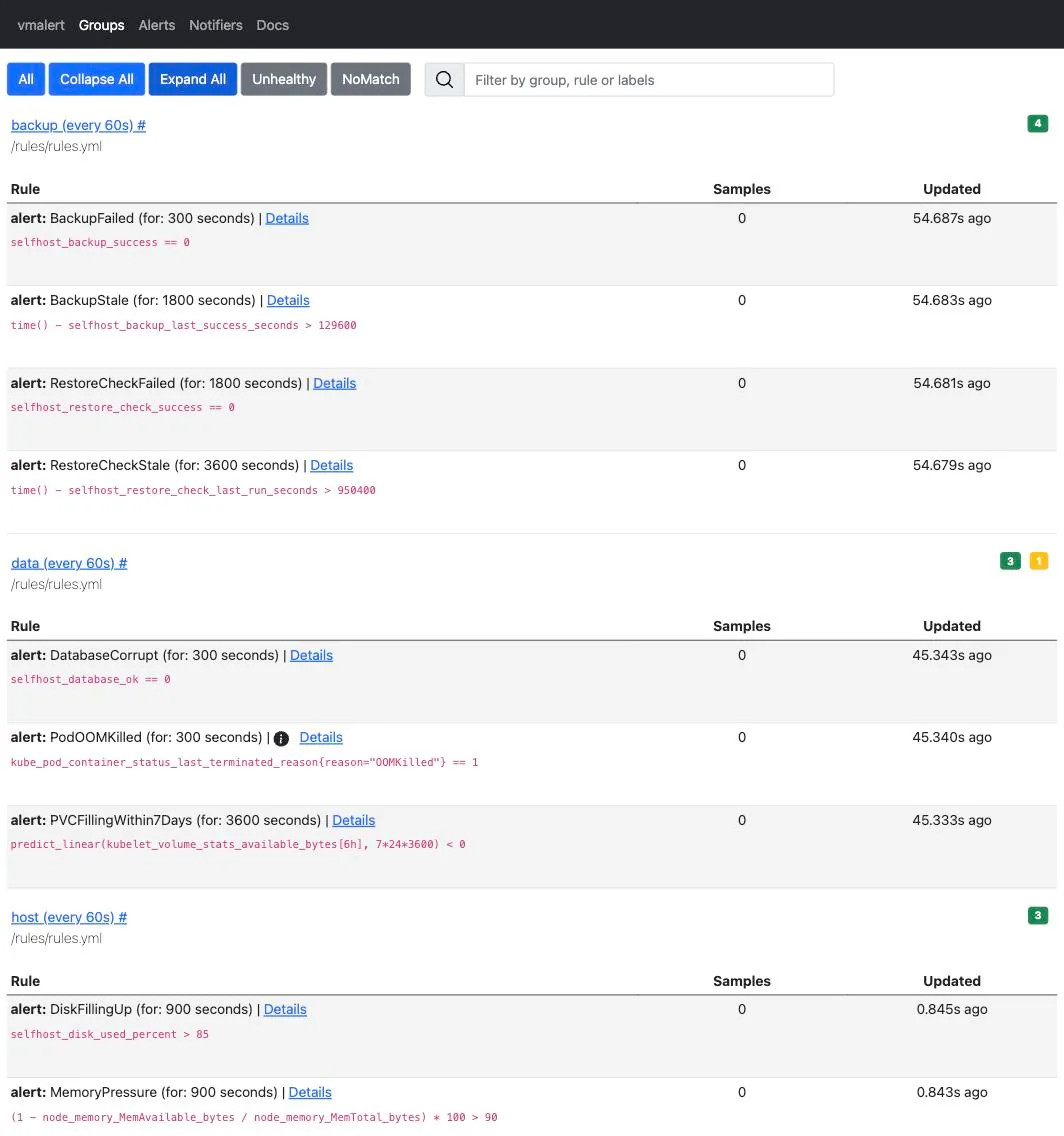
rules.home.skippednote.dev: vmalert
The 22 rules, with the expression each one evaluates. This is the view that was missing: Alertmanager renders only what is firing, so on a healthy cluster it is an empty page and reads as "no alerts configured": the most natural misreading of the whole stack. The rules live here, and had no route until this screenshot needed taking. Samples: 0 against every rule is the healthy state: the condition matched nothing on the last evaluation.
Two of these were structural, and both were fixed structurally rather than by remembering to check. The reload problem moved to kustomize's configMapGenerator, which appends a content hash to the object name: changed rules become a changed name, which is a changed pod spec, which is a rollout. There is no in-process reload left to trust.
The alerting gap was closed by repeat_interval: 6h in Alertmanager: a firing alert re-sends until it resolves, which is precisely what "alert only on change" lacked. And the class of bug itself now has a rule:
k8s/monitoring/rules.yml: the meta group
# Two rules sat dead for a day because the series they queried did not exist.
# A rule with no data is indistinguishable from a rule with nothing to report.
- alert: MetricSourceMissing
  expr: >-
    absent(kube_deployment_status_replicas_unavailable)
    or absent(container_memory_working_set_bytes)
    or absent(node_memory_MemAvailable_bytes)
    or absent(kubelet_volume_stats_available_bytes)
    or absent(selfhost_disk_used_percent)
    or absent(selfhost_job_ok)
  for: 20m
absent() over every series the other rules depend on. This is the rule that would have caught the empty disk and container metrics on day one: and, with some irony, the rule that was itself silently not running until the reload bug was fixed.
The 22 rules now split across seven groups: workloads, host, hostjobs, backup, data, platform, meta. Crucially, none of them ask only "is it running". BackupFailed, RestoreCheckFailed and DatabaseCorrupt exist because those are the failures that actually happened here, and each is fed by a host script publishing its own outcome through the textfile collector.
10. Where it stands
Forty deployments across three namespaces, 25 PVCs, 39 Services of which 8 are LoadBalancers, 124 objects reconciled from git, 22 alert rules, and no Docker Compose. Twenty-one launchd jobs remain on the host deliberately: orbstack-autostart cannot live inside the thing it starts, battery and disk-alert read Mac state a pod cannot see, and the backup and watchdog jobs have to observe from outside the cluster to be useful when it breaks.
Honest remaining constraints: memory requests sit at 7,974 MiB of 8,999 MiB allocatable, which is tighter than it should be for a permanent monitoring stack. Per-container network and filesystem metrics are unavailable on this substrate and won't be without a standard kubelet. And the local export directory is ~9.9 GB against a single offsite snapshot, which is the cheapest remaining answer to a disk at 84%.
The migration took roughly 40 commits. Perhaps a third were the migration; the rest were finding out that things which claimed to work didn't.
FAQ
Why move this homelab from Compose to Kubernetes?
The deciding factor was storage, not scheduling. Moving write-heavy SQLite databases from macOS bind mounts to local-path PVCs put them on the Linux VM's ext4 filesystem instead of virtiofs.
Why did healthy containers hide corrupt SQLite databases?
The process-level health checks could return successfully before touching the corrupt pages. A direct 15-byte SQLite header check tested the data that had actually failed.
Does OrbStack Kubernetes share images with Docker?
Yes. OrbStack uses the same container engine for Docker and Kubernetes, so locally built images are available to pods without a separate local registry.
How is the single-node cluster monitored?
VictoriaMetrics retains metrics, VictoriaLogs retains pod logs, Grafana presents both, and vmalert sends alerts through Alertmanager. Host scripts publish backup, restore, database, disk, and launchd-job outcomes through node-exporter's textfile collector.
Single-node Kubernetes v1.34.8+orb1 on OrbStack, macOS, Apple Silicon · docker://29.4.0 · local-path storage · Flux v2.9.4 with SOPS/age · VictoriaMetrics + VictoriaLogs + Grafana + Alertmanager. All figures measured on the live cluster at time of writing.